Strategy Tester Report
Stoch EA-mm-V4
AlpariUK-Demo (Build 226)
| Symbol | GBPUSD (Great Britain Pound vs US Dollar) | ||||
| Period | 1 Hour (H1) 2010.01.04 00:00 - 2010.04.16 00:00 (2010.01.01 - 2010.04.16) | ||||
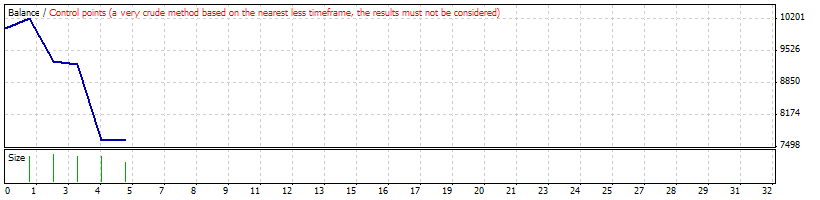
| Model | Control points (a very crude method, the results must not be considered) | ||||
| Parameters | mm=1; reinv=10; MagicNumber=0; SignalMail=false; EachTickMode=false; Lots=0.1; Slippage=3; UseStopLoss=false; StopLoss=200; UseTakeProfit=false; TakeProfit=600; UseTrailingStop=false; TrailingStop=30; maxLots=50; emergencystoploss=true; stoponslowstoch=true; TPonWPR=true; | ||||
| Bars in test | 2762 | Ticks modelled | 44844 | Modelling quality | n/a |
| Mismatched charts errors | 9 | ||||
| Initial deposit | 10000.00 | ||||
| Total net profit | -2356.96 | Gross profit | 232.44 | Gross loss | -2589.40 |
| Profit factor | 0.09 | Expected payoff | -471.39 | ||
| Absolute drawdown | 3564.56 | Maximal drawdown | 4722.56 (42.32%) | Relative drawdown | 42.32% (4722.56) |
| Total trades | 5 | Short positions (won %) | 2 (0.00%) | Long positions (won %) | 3 (66.67%) |
| Profit trades (% of total) | 2 (40.00%) | Loss trades (% of total) | 3 (60.00%) | ||
| Largest | profit trade | 217.00 | loss trade | -1609.10 | |
| Average | profit trade | 116.22 | loss trade | -863.13 | |
| Maximum | consecutive wins (profit in money) | 1 (217.00) | consecutive losses (loss in money) | 3 (-2589.40) | |
| Maximal | consecutive profit (count of wins) | 217.00 (1) | consecutive loss (count of losses) | -2589.40 (3) | |
| Average | consecutive wins | 1 | consecutive losses | 3 | |
| # | Time | Type | Order | Size | Price | S / L | T / P | Profit | Balance |
| 1 | 2010.01.04 09:00 | buy | 1 | 1.00 | 1.61249 | 0.00000 | 0.00000 | ||
| 2 | 2010.01.04 14:00 | close | 1 | 1.00 | 1.61466 | 0.00000 | 0.00000 | 217.00 | 10217.00 |
| 3 | 2010.01.22 06:00 | sell | 2 | 1.10 | 1.62098 | 0.00000 | 0.00000 | ||
| 4 | 2010.01.22 10:00 | close | 2 | 1.10 | 1.62919 | 0.00000 | 0.00000 | -903.10 | 9313.90 |
| 5 | 2010.02.08 20:00 | sell | 3 | 1.00 | 1.56204 | 0.00000 | 0.00000 | ||
| 6 | 2010.02.09 03:00 | close | 3 | 1.00 | 1.56279 | 0.00000 | 0.00000 | -77.20 | 9236.70 |
| 7 | 2010.03.18 08:00 | buy | 4 | 1.00 | 1.53289 | 0.00000 | 0.00000 | ||
| 8 | 2010.03.19 09:00 | close | 4 | 1.00 | 1.51680 | 0.00000 | 0.00000 | -1609.10 | 7627.60 |
| 9 | 2010.04.02 14:00 | buy | 5 | 0.80 | 1.52777 | 0.00000 | 0.00000 | ||
| 10 | 2010.04.09 00:00 | close | 5 | 0.80 | 1.52797 | 0.00000 | 0.00000 | 15.44 | 7643.04 |